| Edition: Level: |
Sigma Enterprise medium |
Successive aka 3-point estimating in Sigma means work with successive quantities and/or unit cost prices
Based on the entered values Sigma calculates a successive cost price, standard deviation on the cost prices and en successiv kostpris, standardafvigelsen på kostprisen samt den indbyrdes vægtning af flere successive kalkulationsposter
Read about the formulas – formulated by professor Steen Lichtenberg – at the end of this guide
Get access to successive values columns
| 1. | Click Successiv calculation (Successive group, Home ribbon) |
|
Content page now show some additional columns
|

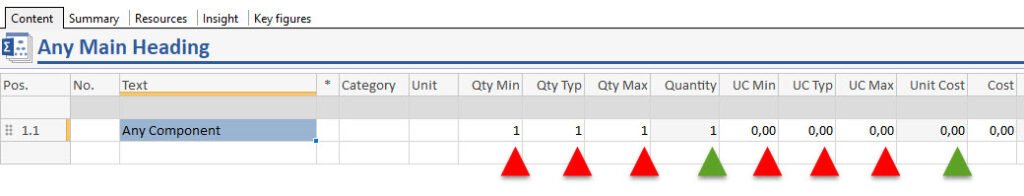
Enter successive quantities and/or unit costs
| 1. | Select a component |
| 2. |
Enter quantitues this way
|
|
|
| 3. |
Enter unit costs this way
|
|
Successive analysis
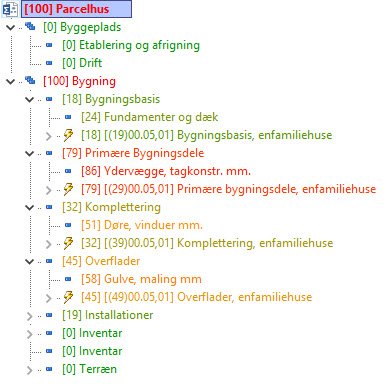
| 1. | Click Tree Analyse (Successive group, Home ribbon) |
|
|
| 2. | Click Tree Analysis to hide the coloring of the Work Breakdown Structure |
Formulas for successive estimating in Sigma
Successive estimating in Sigma in general
The priciples described in the book “Proactive Management of Uncertainty using the Successive Principle” by Steen Lichtenberg are applied in Sigma
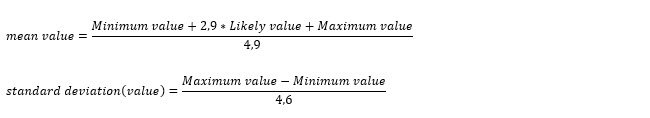
Estimated Quantity and Unit Cost price
Entered successive quantities and/or unit cost prices are used in following formulas

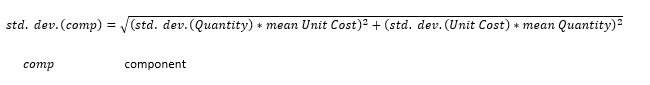
Estimated Standard Deviation for component without subcomponents
For components (line items) not … Standard Deviation is calculated by the following formula
Estimated Standard Deviation for component with subcomponents
For components (line items) not … Standard Deviation is calculated by the following formulas

In additionally this formula